Checking for identity and potential contaminants
For sequence analysis we find it is best to use online tools to ensure you are using the latest versions of the programs and datasets. You can open the FASTA file in MS word (using right click Open with), then copy and paste the sequences into these websites.
For checking sequences for contamination and/or establishing a taxonomic identity, we would commonly “blast” our sequences against the BOLD and GenBank databases. By statistically assessing how well database and query sequences match, we can infer homology and transfer information (such as putative species membership) to the query sequence.
For checking sequences for contamination and/or establishing a taxonomic identity, we would commonly “blast” our sequences against the BOLD and GenBank databases. By statistically assessing how well database and query sequences match, we can infer homology and transfer information (such as putative species membership) to the query sequence.
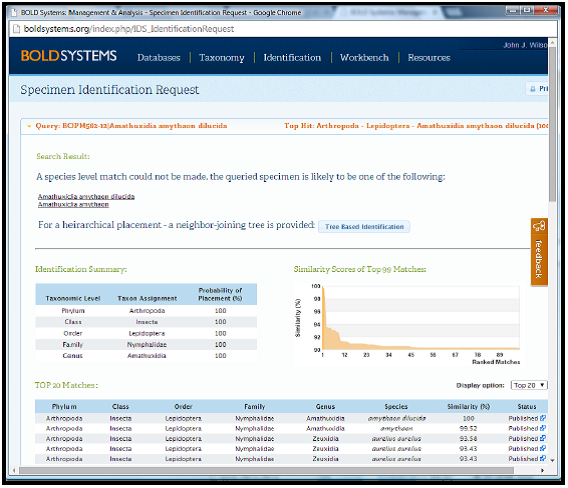
BOLD: Identification Engine
http://boldsystems.org/index.php/IDS_OpenIdEngine
An example of a search result is shown below where the sequence can be conclusively identified as Amauthuxidia amythaon.
An example of a search result is shown below where the sequence can be conclusively identified as Amauthuxidia amythaon.
genbank: blast
http://blast.ncbi.nlm.nih.gov/Blast.cgi
An example of a search result is shown below where the sequence can be conclusively identified as Amauthuxidia amythaon.
An example of a search result is shown below where the sequence can be conclusively identified as Amauthuxidia amythaon.
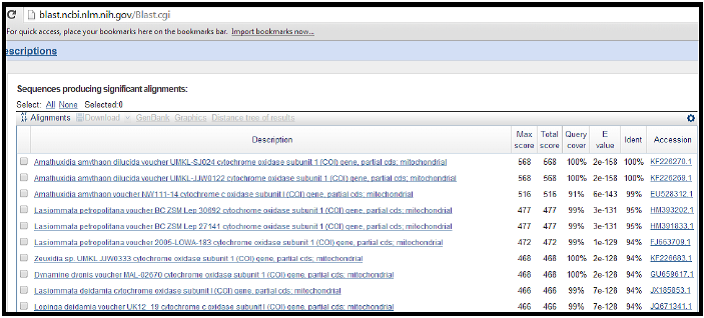
Interpreting Blast scores
Max score = highest alignment score (bit-score) between the query sequence and the database sequence segment. *Higher the better. 1000 is very good.
Total score = sum of alignment scores of all segments from the same database sequence that match the query sequence (calculated over all segments). *Not so applicable for protein-coding genes.
Query coverage = percent of the query length that is included in the aligned segments. *Not meaningful for our purpose.
E-value = number of alignments expected by chance with a particular score or better. The expect value is the default sorting metric and normally gives the same sorting order as Max score. *The closer to 0 the better. Most important metric for DNA barcoding.
